

What you will learn in this articleIn this blog post, you can discover the origins of engineering fatigue assessment and learn, based on a real simulation problem, how to apply S–N curves to assess high-cycle fatigue. |
Introduction
Fatigue is arguably the most common mechanism of component failure (Bannantine et al., 1990). While static overloads can result in sudden failure, fatigue damage from repeated cycling will progressively develop throughout the component’s life, leading to sudden failure at stresses well below its yield point. A large number of historical rail disasters (such as the Versailles and Amstetten train disasters, which killed dozens) spurred August Wöhler to conduct a systematic investigation into the effects of repetitive loading on materials. The results of his investigations are still illustrated today by the S-N Curve (also known as the Wöhler Curve), one of the fundamental tools used to assess fatigue in engineering.
Over time, modern fatigue analysis has progressed significantly beyond classical S-N approaches to include fracture mechanics, multiaxial fatigue models, stochastic load spectra, and various methods for quantifying accumulated damage, all of which we introduce in our Wiki. At the same time, fatigue has become increasingly important because almost all modern industries are subject to cyclic loads, including transportation, aerospace, energy systems, and medical devices (i.e., virtually every industry that depends on safety-critical performance).
Use Case Motivation
Wind turbines are among the primary technologies for developing the next generation of power transmission systems to support the worldwide transition to renewable energy sources. Due to their increasing size (e.g., larger turbines with longer hub heights) and increasingly remote locations (e.g., offshore installations), the need to predict structural reliability and service life has never been greater.
The majority of modern wind turbine blades are manufactured using composite materials. Composites exhibit significant improvements in strength-to-weight ratio as compared to metal, resulting in reduced gravity-induced loading on structures. Additionally, composites exhibit superior corrosion resistance and may be more easily optimized based on anticipated load paths and desired stiffness values for each blade section.
Perhaps most importantly, though, composite materials demonstrate superior fatigue characteristics. Composite fatigue typically exhibits greater inherent damage tolerance (instead of abrupt failure) and fewer classical crack-propagation characteristics than metals. Given the very large numbers of cycles experienced by wind turbine blades during operation, the amount of fatigue damage developed within the composite material over time is significantly smaller than would be observed in a similar metal part.
In this use case, we demonstrate this concept by simulating the fatigue behavior of an aluminum wind turbine blade, illustrating why such a design would not be practical.
Introduction to Fatigue in Metals – S-N Curve Approach
Let’s look at the Wöhler Curve in greater detail. It describes the relationship between the stress amplitude S and the number of cycles to failure N for a specific material. This curve can be established experimentally through many cyclic sample tests and is generally available.
Typical S-N Curves for Metals
In general, S-N curves show a dramatic decrease in the expected life span of a metal when subjected to higher stress amplitudes. Additionally, while many steel alloys exhibit a “fatigue limit” that represents a maximum stress below which the alloy has theoretically limitless life, aluminum alloys are known to lack a well-defined fatigue limit; thus, even low stress levels can lead to significant accumulated damage after sufficient cycling. Therefore, aluminum alloys are much more susceptible to fatigue failures than steel alloys, especially under high-cycle conditions, i.e., thousands of cycles per hour, such as for wind turbine blades.
Creation of Use Cases
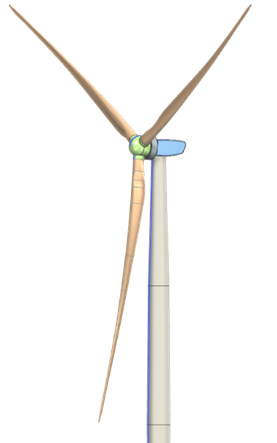
To conduct this research project, we updated our internal 60-meter hub wind turbine computer model and used EN AW-6061 aluminum for the blades and the internal shear webs. We assumed a constant sheet wall thickness of 20 millimeters.
Load Case Development
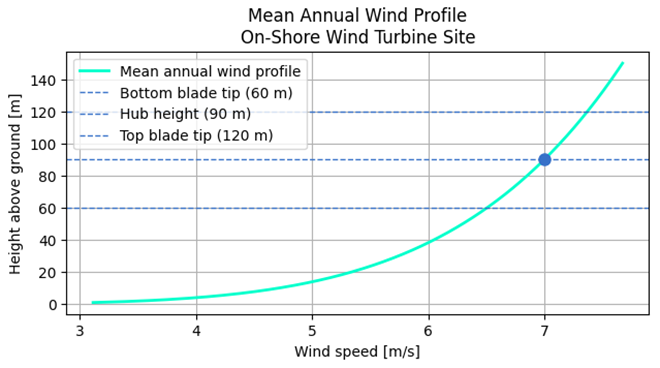
To perform fatigue analysis using the S-N curve approach in the high-cycle fatigue range, we created a load case consisting of two parts: (i) the cyclic gravitational force acting on the blade due to the rotation and (ii) the assumed constant aerodynamic forces plus the centripetal force. The pressure fields associated with the aerodynamic forces were extracted from a previous FSI simulation conducted by FiniteNow for the true composite blade in the horizontal position in a reference wind field plotted above.
Transformation of Load Case into Equivalent Reference Stress Amplitude Suitable for S-N Assessment
Since the load case consists of a constant aerodynamic (plus centripetal) contribution and a sinusoidal gravitational loading due to blade rotation, the loading must first be transformed into an equivalent reference stress amplitude suitable for S–N assessment.
It is worth noting that two serious assumptions underlie the validity of our proposed model. First, since the simulated pressure field was based on the structural characteristics of a composite blade rather than those of an aluminum blade, it is likely that a fluid-structure interaction simulation carried out directly on an aluminum blade would yield somewhat different results. Second, we did not account for spatial variations in wind speed along the blade length. Wind speed increases linearly with elevation, and local load fluctuations are produced near the base of the tower by downwash and turbulent flow.
As a reference lifespan, we assume a target of 20 years of service with a mean rotational speed of 15 RPM. This equates to roughly 158 million cycles.
S-N Calculation Workflow
To evaluate the fatigue behavior of the aluminum blade, we employed a classical S–N methodology due to the high cycle count. The structural stresses from the finite element model under the specified loads need to be compared with the material’s Wöhler Curve. Based on this comparison, it is possible to determine how long the material can withstand before failure in terms of load cycles.
The overall calculation process is simple. We first enter the blade geometry, including its internal shear webs, material properties, and the various loads, into the finite element model. By running the simulation, the stress history at each location (node) on the blade is determined. The stress history consists of two components: a static, or constant, component resulting from aerodynamic forces acting on the blade, and a dynamic, or variable, component due to gravitational forces. Therefore, once we have identified both components of the stress history, we can transform them into an equivalent stress amplitude through the Goodman correction.
The value is then compared to the S-N curve for the specific material being utilized. Locations experiencing increased stress concentration will exhibit lower fatigue life. By comparing each node on the blade to the S-N curve, we can identify locations that may fail due to excessive fatigue. Thus, we can provide a preliminary estimate of whether the entire structure will be capable of surviving the required number of load cycles under normal operational conditions.
The Fatigue Properties of EN AW-6061-T6
An S-N curve for EN AW-6061-T6 sheet metal was selected for evaluating fatigue performance:
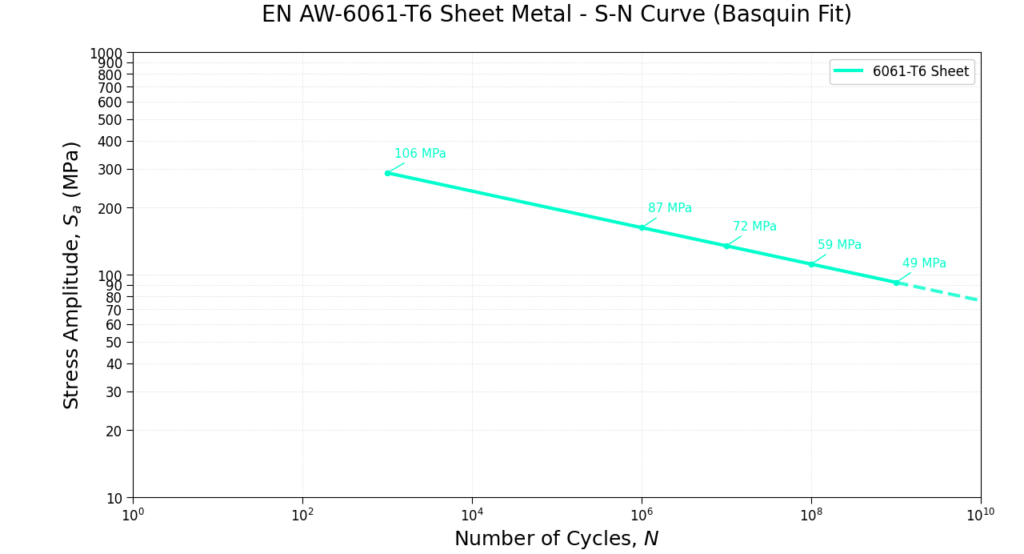
An S-N curve represents the relationship between stress amplitude and the number of cycles to failure for a given material. A Basquin-type fit was used to develop this curve.
This S-N curve exhibits a typical response of aluminum alloys. Unlike many other steel materials, there is no true endurance limit. Therefore, even after numerous cycles, the maximum allowable stress amplitude for aluminum continues to decrease. Due to this characteristic behavior, aluminum presents significant challenges in high-cycle fatigue environments, such as those in wind turbines, where continuous operation over decades may occur.
Results & Interpretations
A visualization of the simulated fatigue damage at a single blade can be seen here:
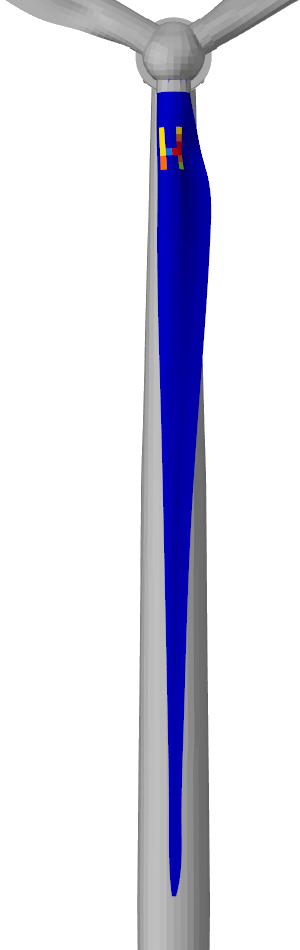
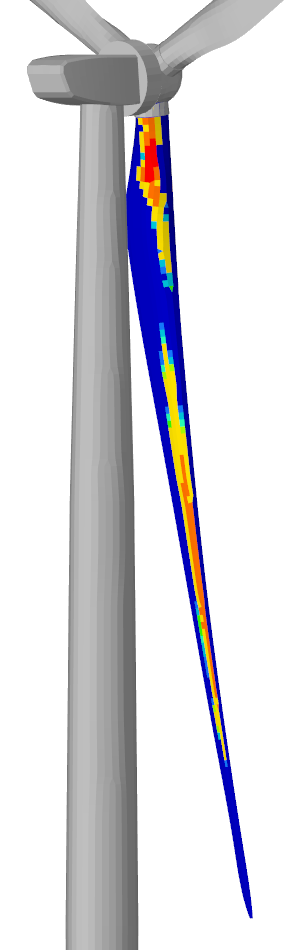
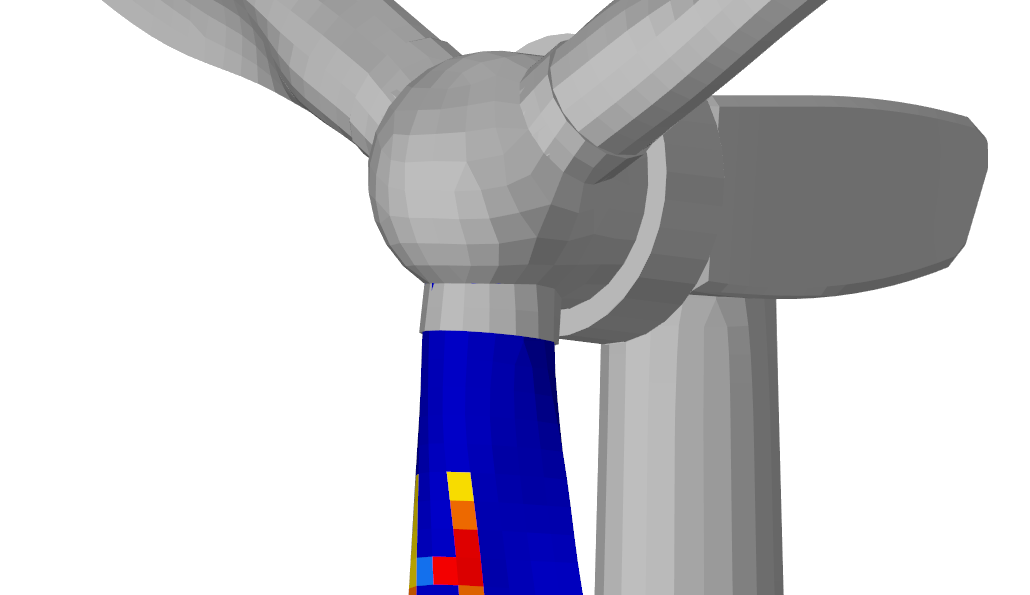
The regions with damage values greater than 1 are displayed in red. Overall, the simulation suggests that the selected materials will fail prior to reaching the desired target fatigue lifetime. The highest damage values, about 1.3, occur at the blade root, where the highest lever arm exists.
One of the most important design parameters is, of course, the sheet wall thickness. Naively, a thicker sheet may result in lower stresses and therefore longer fatigue lifetimes; however, by virtue of its increased mass, it will increase the magnitude of the gravitational loads applied to the structure. Thus, choosing this value should, in general, be based on properly resolving the optimization problem.
Several different wall thicknesses were examined in this project. The current study selected a wall thickness of 20mm as optimal based on all factors, including sheet availability. A more thorough investigation of various other potential variables could likely lead to a better solution. Additionally, it should be noted that the detailed internal mechanical support system was intentionally omitted from this discussion to maintain focus on the primary issue of fatigue in metal wind turbine blades rather than composites.
Although this use case is somewhat artificial and intended more as an illustrative example than as a complete industrial case study, it still highlights the difficulty of achieving comparable lifetime performance with metallic wind turbine blades relative to their composite counterparts.
Expert Fatigue Analysis through FiniteNow’s Services
This use case reflects a broader engineering reality. It is no longer sufficient to design components or systems conservatively safe. To stay competitive in today’s market, it is essential to optimize designs with fatigue in mind to guarantee effective components that are neither safe but heavy, nor light but risky.
However, with that, the engineering demand rises significantly. Fatigue often needs non-linear analysis, a sound understanding of standards, and thorough checks with the environment in mind.
It is no longer easy nor cost-effective to have all these competencies in-house. Rather, external solutions are the key accelerator to make your project thrive. This holds true across all sectors: Energy, Aerospace, Automotive, Medical, and Industrial equipment.
If you are looking for a strong partner, FiniteNow helps you tackle challenging fatigue problems so you do not need to worry about the complexities of realization.
Feel free to reach out to us and inquire about FiniteNow’s strengths in feasibility studies, design optimizations, simulation support, or general engineering consulting.
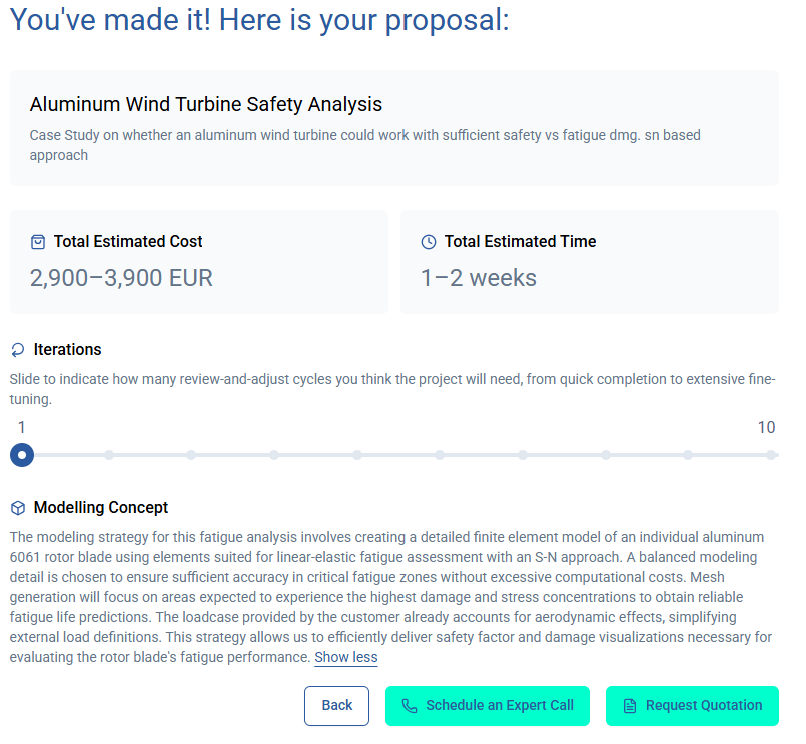
Let yourself be convinced today by visiting our online instant-quoting tool. Gain reliable project plans and cost projections within mere minutes:
Simulation Work Reinvented